Interactive widgets#
What are widgets?#
Widgets are eventful python objects that have a representation in the browser, often as a control like a slider, textbox, etc.
This notebook is an introduction to ipywidgets (see docs here),
one of the most popular widgets libraries for Jupyter.
What can they be used for?#
You can use widgets to build interactive GUIs for your notebooks. You can also use widgets to synchronize stateful and stateless information between Python and JavaScript.
Using widgets#
To use the widget framework, you need to import ipywidgets.
import ipywidgets as ipw
repr#
Widgets have their own display repr which allows them to be displayed using IPython’s display framework.
Constructing and returning an IntSlider automatically displays the widget (as seen below).
Widgets are displayed inside the output area below the code cell.
Clearing cell output will also remove the widget.
slider = ipw.IntSlider()
slider
Closing widgets#
You can close a widget by calling its close() method.
# slider.close()
Widget properties#
All of the IPython widgets share a similar naming scheme.
To read the value of a widget, you can query its value property.
w = ipw.IntSlider()
w
w.value
0
Similarly, to set a widget’s value, you can set its value property.
w.value = 55
Widget list#
This is a non-exhaustive list of the mostly used widgets. You can see the full list here.
Numeric widgets#
There are many widgets distributed with ipywidgets that are designed to display numeric values.
Widgets exist for displaying integers and floats, both bounded and unbounded.
The integer widgets share a similar naming scheme to their floating point counterparts.
By replacing Float with Int in the widget name, you can find the Integer equivalent.
IntSlider#
ipw.IntSlider(
    value=7,
    min=0,
    max=10,
    step=1,
    description="Test:",
    disabled=False,
    continuous_update=False,
    orientation="horizontal",
    readout=True,
    readout_format="d",
)
FloatSlider#
ipw.FloatSlider(
    value=7.5,
    min=0,
    max=10.0,
    step=0.1,
    description="Test:",
    disabled=False,
    continuous_update=False,
    orientation="horizontal",
    readout=True,
    readout_format=".1f",
)
IntRangeSlider#
ipw.IntRangeSlider(
    value=[2, 7],
    min=0,
    max=10,
    step=1,
    description="Test:",
    disabled=False,
    continuous_update=False,
    orientation="horizontal",
    readout=True,
    readout_format="d",
)
FloatProgress#
ipw.FloatProgress(
    value=7.5,
    min=0,
    max=10.0,
    step=0.1,
    description="Loading:",
    bar_style="info",
    orientation="horizontal",
)
IntText#
ipw.IntText(value=7, description="An integer:", disabled=False)
Boolean widgets#
There are three widgets that are designed to display a boolean value.
Checkbox#
ipw.Checkbox(value=False, description="Check me", indent=False)
Selection widgets#
There are several widgets that can be used to display single selection lists, and two that can be used to select multiple values.
All inherit from the same base class.
You can specify the enumeration of selectable options by passing a list (options are either (label, value) pairs, or simply values for which the labels are derived by calling str).
Dropdown#
ipw.Dropdown(
    options=["1", "2", "3"],
    value="2",
    description="Number:",
    disabled=False,
)
The following is also valid, displaying the words 'One', 'Two', 'Three' as the dropdown choices but returning the values 1, 2, 3.
ipw.Dropdown(
    options=[("One", 1), ("Two", 2), ("Three", 3)],
    value=2,
    description="Number:",
)
String widgets#
There are several widgets that can be used to display a string value.
The Text and Textarea widgets accept input.
The HTML and HTMLMath widgets display a string as HTML (HTMLMath also renders math).
The Label widget can be used to construct a custom control label.
Text#
ipw.Text(
    value="Hello World",
    placeholder="Type something",
    description="String:",
    disabled=False,
)
Textarea#
ipw.Textarea(
    value="Hello World",
    placeholder="Type something",
    description="String:",
    disabled=False,
)
Label#
The Label widget is useful if you need add custom text and place it next to other widgets.
ipw.HBox(
    [
        ipw.Label(value=r"This is before the slider"),
        ipw.FloatSlider(),
        ipw.Label(value=r"This is after the slider"),
    ]
)
HTML#
ipw.HTML(
    value="Hello <b>World</b>",
)
Image#
file = open("images/ESS_02_small.jpg", "rb")
image = file.read()
ipw.Image(
    value=image,
    format="jpg",
    width=300,
    height=400,
)
Container/Layout widgets#
These widgets are used to hold other widgets, called children. Each has a children property that may be set either when the widget is created or later.
HBox#
items = [ipw.Button(description=str(i)) for i in range(4)]
ipw.HBox(items)
VBox#
left_box = ipw.VBox([items[0], items[1]])
right_box = ipw.VBox([items[2], items[3]])
ipw.HBox([left_box, right_box])
Widget events#
Widget properties are IPython traitlets and traitlets are eventful. To handle changes, the observe method of the widget can be used to register a callback. The doc string for observe can be seen below.
help(ipw.Widget.observe)
Help on function observe in module traitlets.traitlets:

observe(self, handler: 't.Callable[..., t.Any]', names: 'Sentinel | str | t.Iterable[Sentinel | str]' = traitlets.All, type: 'Sentinel | str' = 'change') -> 'None'
    Setup a handler to be called when a trait changes.

    This is used to setup dynamic notifications of trait changes.

    Parameters
    ----------
    handler : callable
        A callable that is called when a trait changes. Its
        signature should be ``handler(change)``, where ``change`` is a
        dictionary. The change dictionary at least holds a 'type' key.
        * ``type``: the type of notification.
        Other keys may be passed depending on the value of 'type'. In the
        case where type is 'change', we also have the following keys:
        * ``owner`` : the HasTraits instance
        * ``old`` : the old value of the modified trait attribute
        * ``new`` : the new value of the modified trait attribute
        * ``name`` : the name of the modified trait attribute.
    names : list, str, All
        If names is All, the handler will apply to all traits.  If a list
        of str, handler will apply to all names in the list.  If a
        str, the handler will apply just to that name.
    type : str, All (default: 'change')
        The type of notification to filter by. If equal to All, then all
        notifications are passed to the observe handler.
Mentioned in the doc string, the callback registered must have the signature handler(change) where change is a dictionary holding the information about the change.
Using this method, an example of how to output an IntSlider’s value as it is changed can be seen below.
sl = ipw.IntSlider()
but = ipw.Button()


def on_value_change(change):
    but.description = str(change["new"])


sl.observe(on_value_change, names="value")

ipw.HBox([sl, but])
Linking Widgets#
Often, you may want to simply link widget attributes together. Synchronization of attributes can be done in a simpler way than by using bare traitlets events.
The method is to use the link and dlink functions from the traitlets module (these two functions are re-exported by the ipywidgets module for convenience). This only works if we are interacting with a live kernel.
caption = ipw.Label(value="The values of slider1 and slider2 are synchronized")
sliders1, slider2 = ipw.IntSlider(description="Slider 1"), ipw.IntSlider(
    description="Slider 2"
)
l = ipw.link((sliders1, "value"), (slider2, "value"))
display(caption, sliders1, slider2)
caption = ipw.Label(value="Changes in source values are reflected in target1")
source, target1 = ipw.IntSlider(description="Source"), ipw.IntSlider(
    description="Target 1"
)
dl = ipw.dlink((source, "value"), (target1, "value"))
display(caption, source, target1)
The link() and dlink() functions return a Link or DLink object.
The link can be broken by calling the unlink method.
l.unlink()
dl.unlink()
Using “Interact”#
ipywidgets also comes with a high-level function called interact which tries to do a lot of the work for you, by guessing what kind of widget you would like to have to interact with a function, depending on the function input types.
You can read more on how to use interact here.
Exercises#
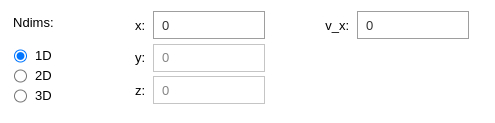
1. Dynamically disabling and hiding widgets#
In this exercise, we will learn how to use the disabled and visibility properties of the widgets, to control their behaviour and appearance.
The goal is to create an interface that allows to enter into text boxes a number of vector components which depend on how many dimensions are available.
Create a
RadioButtonswidget with 3 options:"1D","2D", and"3D", and the"1D"value should be the selected value to begin with.Create 3
FloatTextwidgets which all have0as a value and"x:","y:", and"z:"as descriptions for the vector position.Create a further 3
FloatTextwidgets which all have0as a value and"v_x:","v_y:", and"v_z:"as descriptions for the velocity components.Arrange your widgets into 3 columns using the
VBoxandHBoxwidgets.Disable the
yandzposition components by using the.disabledproperty of the widgets.Hide the
v_yandv_zvelocity components by using the.layout.visibility="hidden"property of the widgets.In the end, it should look something like this:
Create a function that will run through the position and velocity components and update the
.disabledand.visibility="hidden/visible"properties according to the selected value in theRadioButtonswidget.Install a call-back using the
.observeproperty from theRadioButtonsto the update function so that the function is triggered every time the selected value in theRadioButtonsis changed and check that everything is working as it should.Voila!
Bonus: Instead of a
RadioButtons, use aIntTextwidget to allow any number of dimensions to be entered. This means you have to dynamically create/destroyFloatTextwidgets in the positions and velocity columns. The contents of aVBoxcan be modified by changing its list of.children. It also does not make much sense to have disabled or hidden widgets since we do not know a priori the maximum number of dimensions. The goal is to only keep the widgets that we need, and they will all always be visible and enabled.
Solution:
Bonus:
2. Use a slider to change the number of scatter points in a Matplotlib figure#
Create a scatter plot with Matplotlib
import numpy as np
import matplotlib.pyplot as plt

%matplotlib widget

N = 100
x = np.random.normal(0.0, scale=20.0, size=N)
y = np.random.normal(0.0, scale=20.0, size=N)

fig, ax = plt.subplots()
scat = ax.scatter(x, y, color="blue", alpha=0.5)
Add a
FloatLogSliderthat ranges from 1 to 1.0e5Define a function that would take in the value of the slider (via the
changeargument) and update the number of points in the scatter plot (for simplicity, you can delete the current scatter plot and draw a new one on the axes)Add a callback from the slider to the update function using the
observemethod.Display the slider above or below the figure.
Once you got this working, try adding a
ColorPickerwidget that would be used to update the color of the scatter points.
Solution:
3. Create an interface to dynamically resize an image#
In this exercise, we will create an interface with a displayed image and some control widgets below, that will enable dynamic resizing of the image.
Using the
PIL(Python Image Library), get an image from a web url:
import PIL.Image as Image

img = Image.open("images/ESS_02_small.jpg")
img

Place the image inside an
Imagewidget:
im_widget = ipw.Image(value=img._repr_png_(), width=img.width, height=img.height)
Create two
IntTextwidgets (one for the image width and one for the image height) and aButtonwidget that will run the image resizing function when clicked.Place the widgets inside a
HBoxcontainer widget to keep them in the same line, and place theim_widgetand theHBoxinside aVBoxcontainer to place the image above the control widgets.At this point, it is probably a good idea to try and display the
VBoxto check that everything is set up properly.Next, create a function that, when called, would resize the image. In that function, you will need to:
Make a copy of the original image
Resize the copy with the
PILresize()function:copied_image.resize((new_width, new_height))Update the
valueof theim_widgetwith thenew_image._repr_png_()
Finally, you need to install a
on_clickcall-back (see here) from theButtonto the resizing function so that the function is triggered when theButtonis clicked.Voila!
Bonus: Try to achieve the same but using two
IntSliders instead ofIntTextso that you can resize the image by simply dragging sliders!
Solution:
Bonus: